
Which post wins?
Take two TikTok slideshows from the same account, posted within three weeks of each other. Can a model read the copy of both and pick the winner? We asked four frontier models and doublespeed AI, 200 times.
Correct picks on 200 real outcome pairs
 doublespeed AI
Benchmarked 2026-09-01 on 200 pairs from 174 accounts posting through doublespeed. Every model saw the copy of both posts and never the view counts; random guessing lands at 50%. The frontier models answered zero-shot; doublespeed AI was trained on this platform's past outcomes, which is the point.
Try one of the questions yourself
This pair is one of the 200 exam questions. The models saw only the copy; you get the full slides. All four frontier models got it wrong.
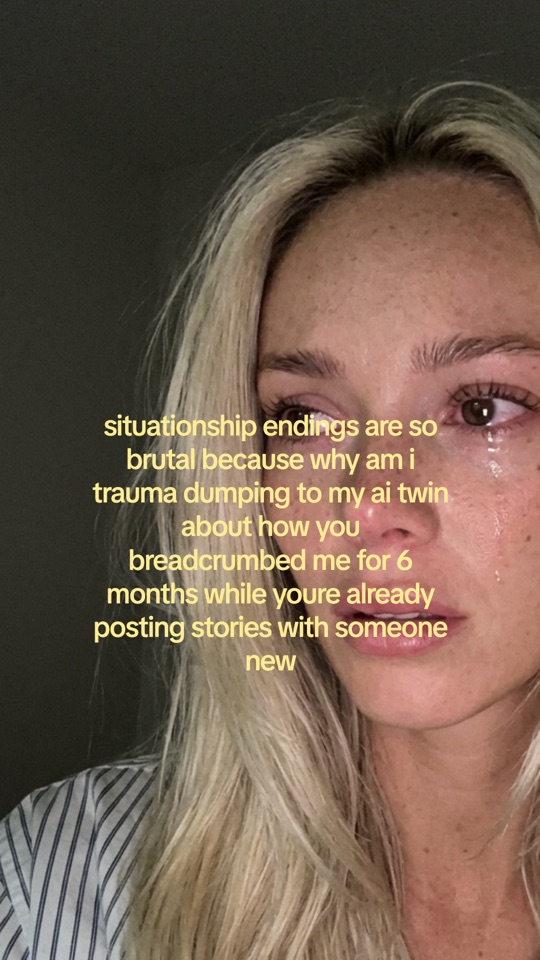
the situationship to ai therapy pipeline is actually insane 💔😭 #fyp #viral #relatable #situationship #healingjourney

turns out most relationship fights are just two people trying to feel understood fr 💭 #relationships #datingadvice #voicedaitwin #couplegoals #emotionalintelligence
Both posts went up on the same account within three weeks. One got over a hundred times the views of the other. Click the one you think won.
How it was measured
The exam is built from real posting history: slideshows published to TikTok through doublespeed, with their view counts. A pair is two posts from the same account within 21 days where the winner got at least 2x the loser's views and at least 500 views. Comparing within one account cancels follower count and algorithmic standing, so the copy is what varies.
Each model saw both posts' slide texts, captions, and slide counts, with the winner's position randomized, and answered one question: "These two TikTok slideshow posts are from the same account. Based only on their copy, which one performs better (gets more views)? Answer with the concept index." No examples, no product briefing, no retries. The Claude models were called through the Anthropic API, GPT 5.6 Sol through OpenRouter; one call per model failed and is excluded from that model's count.
Accuracy is the share of pairs where a model picked the real winner. Intervals are bootstrap 95% confidence intervals over pairs. The frontier models landed at 50.8% to 53.3%, all within their intervals of a coin flip. doublespeed AI landed at 61.0%, and its interval excludes chance. Outcome data moves the needle; model scale alone does not.
Where do viewers stop?
Views measure how far the algorithm carried a post. Retention measures what people did once they saw it: TikTok reports, slide by slide, what share of viewers was still there. We trained a second model to read a draft's slides and predict that curve before anything is posted. Inside doublespeed it ranks draft variants by predicted retention and points at the slide where viewers are likely to leave.
Correct picks on 450 retention pairs
doublespeed retention modelBenchmarked 2026-09-08 on 450 pairs from 60 accounts that were excluded from all training. Every model saw the slides and captions of both posts and never the retention data; random guessing lands at 50%. The doublespeed retention model answered 413 pairs (37 lacked a stored slide); Claude Sonnet 5 answered 410 (40 calls failed). The Qwen fine-tune trained on 6,890 pairs from the other accounts, which lifted it from 51.6% to 63.8% and still left it behind a far smaller model trained on the full retention curves.
Try one of the retention questions
A real pair from the exam. Claude Sonnet 5 saw every slide of both posts and picked the loser.
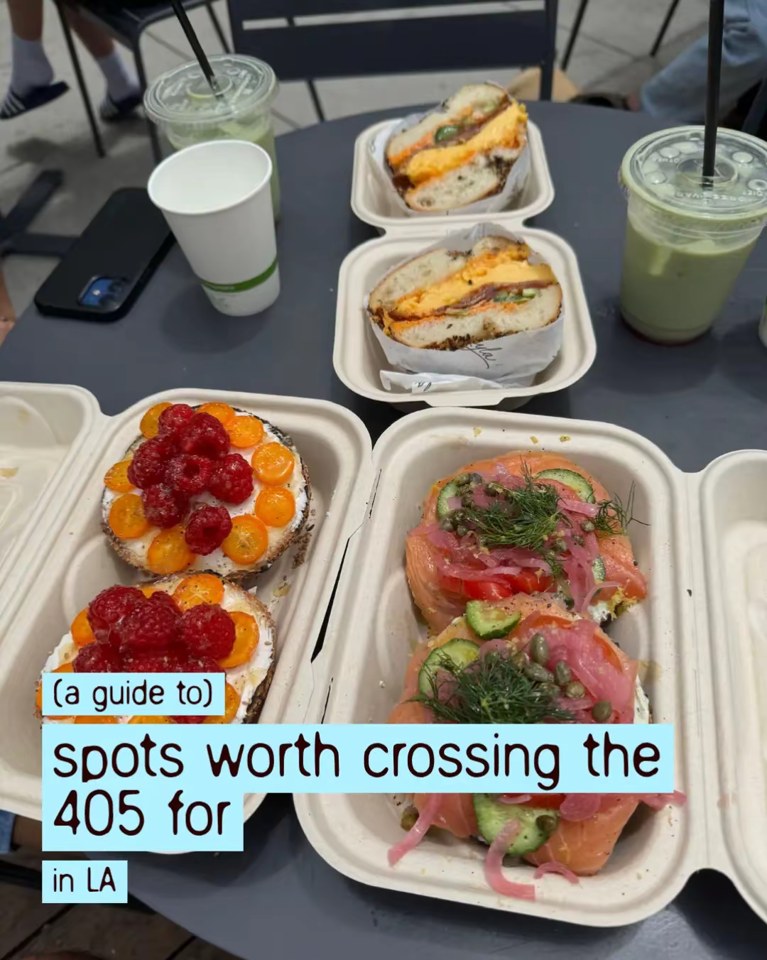
spots worth crossing the 405 for 📍 Market 📍 Felix Trattoria 📍 Gjelina 📍 Crudo e Nudo 📍 Layla Bagels 📍 Bay Cities Italian Deli & Bakery #losangeles #la #losangelesrestaurants

spots in echo park locals won't tell you about ☕ granada 📚 heavy manners library 🍸 dada echo park 🍺 gold room #echopark #losangeles #hiddengems #cornerla
Same account, same city-guide format. One kept three times the share of viewers to its last slide. Click the one you think held people longer.
The exam mirrors the views benchmark: a pair is two slideshows from the same account whose completion rates, the share of viewers reaching the last slide, differ by at least five points. The ground truth comes from per-slide retention analytics collected across our posting network. Each model answered one question: "Both slideshows were posted by the same TikTok account. One kept a substantially larger share of viewers all the way to the last slide. Based on the slides alone, which one? Reply with exactly one letter: A or B."
The doublespeed retention model also predicts the full per-slide curve, within about seven points per slide on average, and flags slides that lose more viewers than a slide in that position normally does. On its most confident flags, the weak slide is in its top two picks 77% of the time.
The models in these benchmarks are the same ones that score every draft inside doublespeed before it goes out. Your posting history makes them sharper.
Contact us for proprietary social data